 Global stocks fell in November’s early trading sessions but pared losses over the last two weeks to end the month relatively flat. U.S. stocks (S&P 500) are +2.4% YTD with international equities (ACWI ex-U.S.) -3.9%YTD.
S&P 500 advanced almost 3% over the last two weeks alone as positive data emerged including an increase in new home sales, home prices, and durable orders. U.S GDP growth increased in Q3 while across the pond, economic activity in the Eurozone grew at the fastest pace since May 2011. The data provided strong support for the Federal Reserve to potentially raise lending rates at their December meeting.
NorthCoast added over 10% equity exposure to its flagship strategy, CAN SLIM®, as market outlook improved throughout November. Thanks in large part to strong macroeconomic data and positive technical indicators, NorthCoast increased equity exposure across the majority of its tactical strategies.
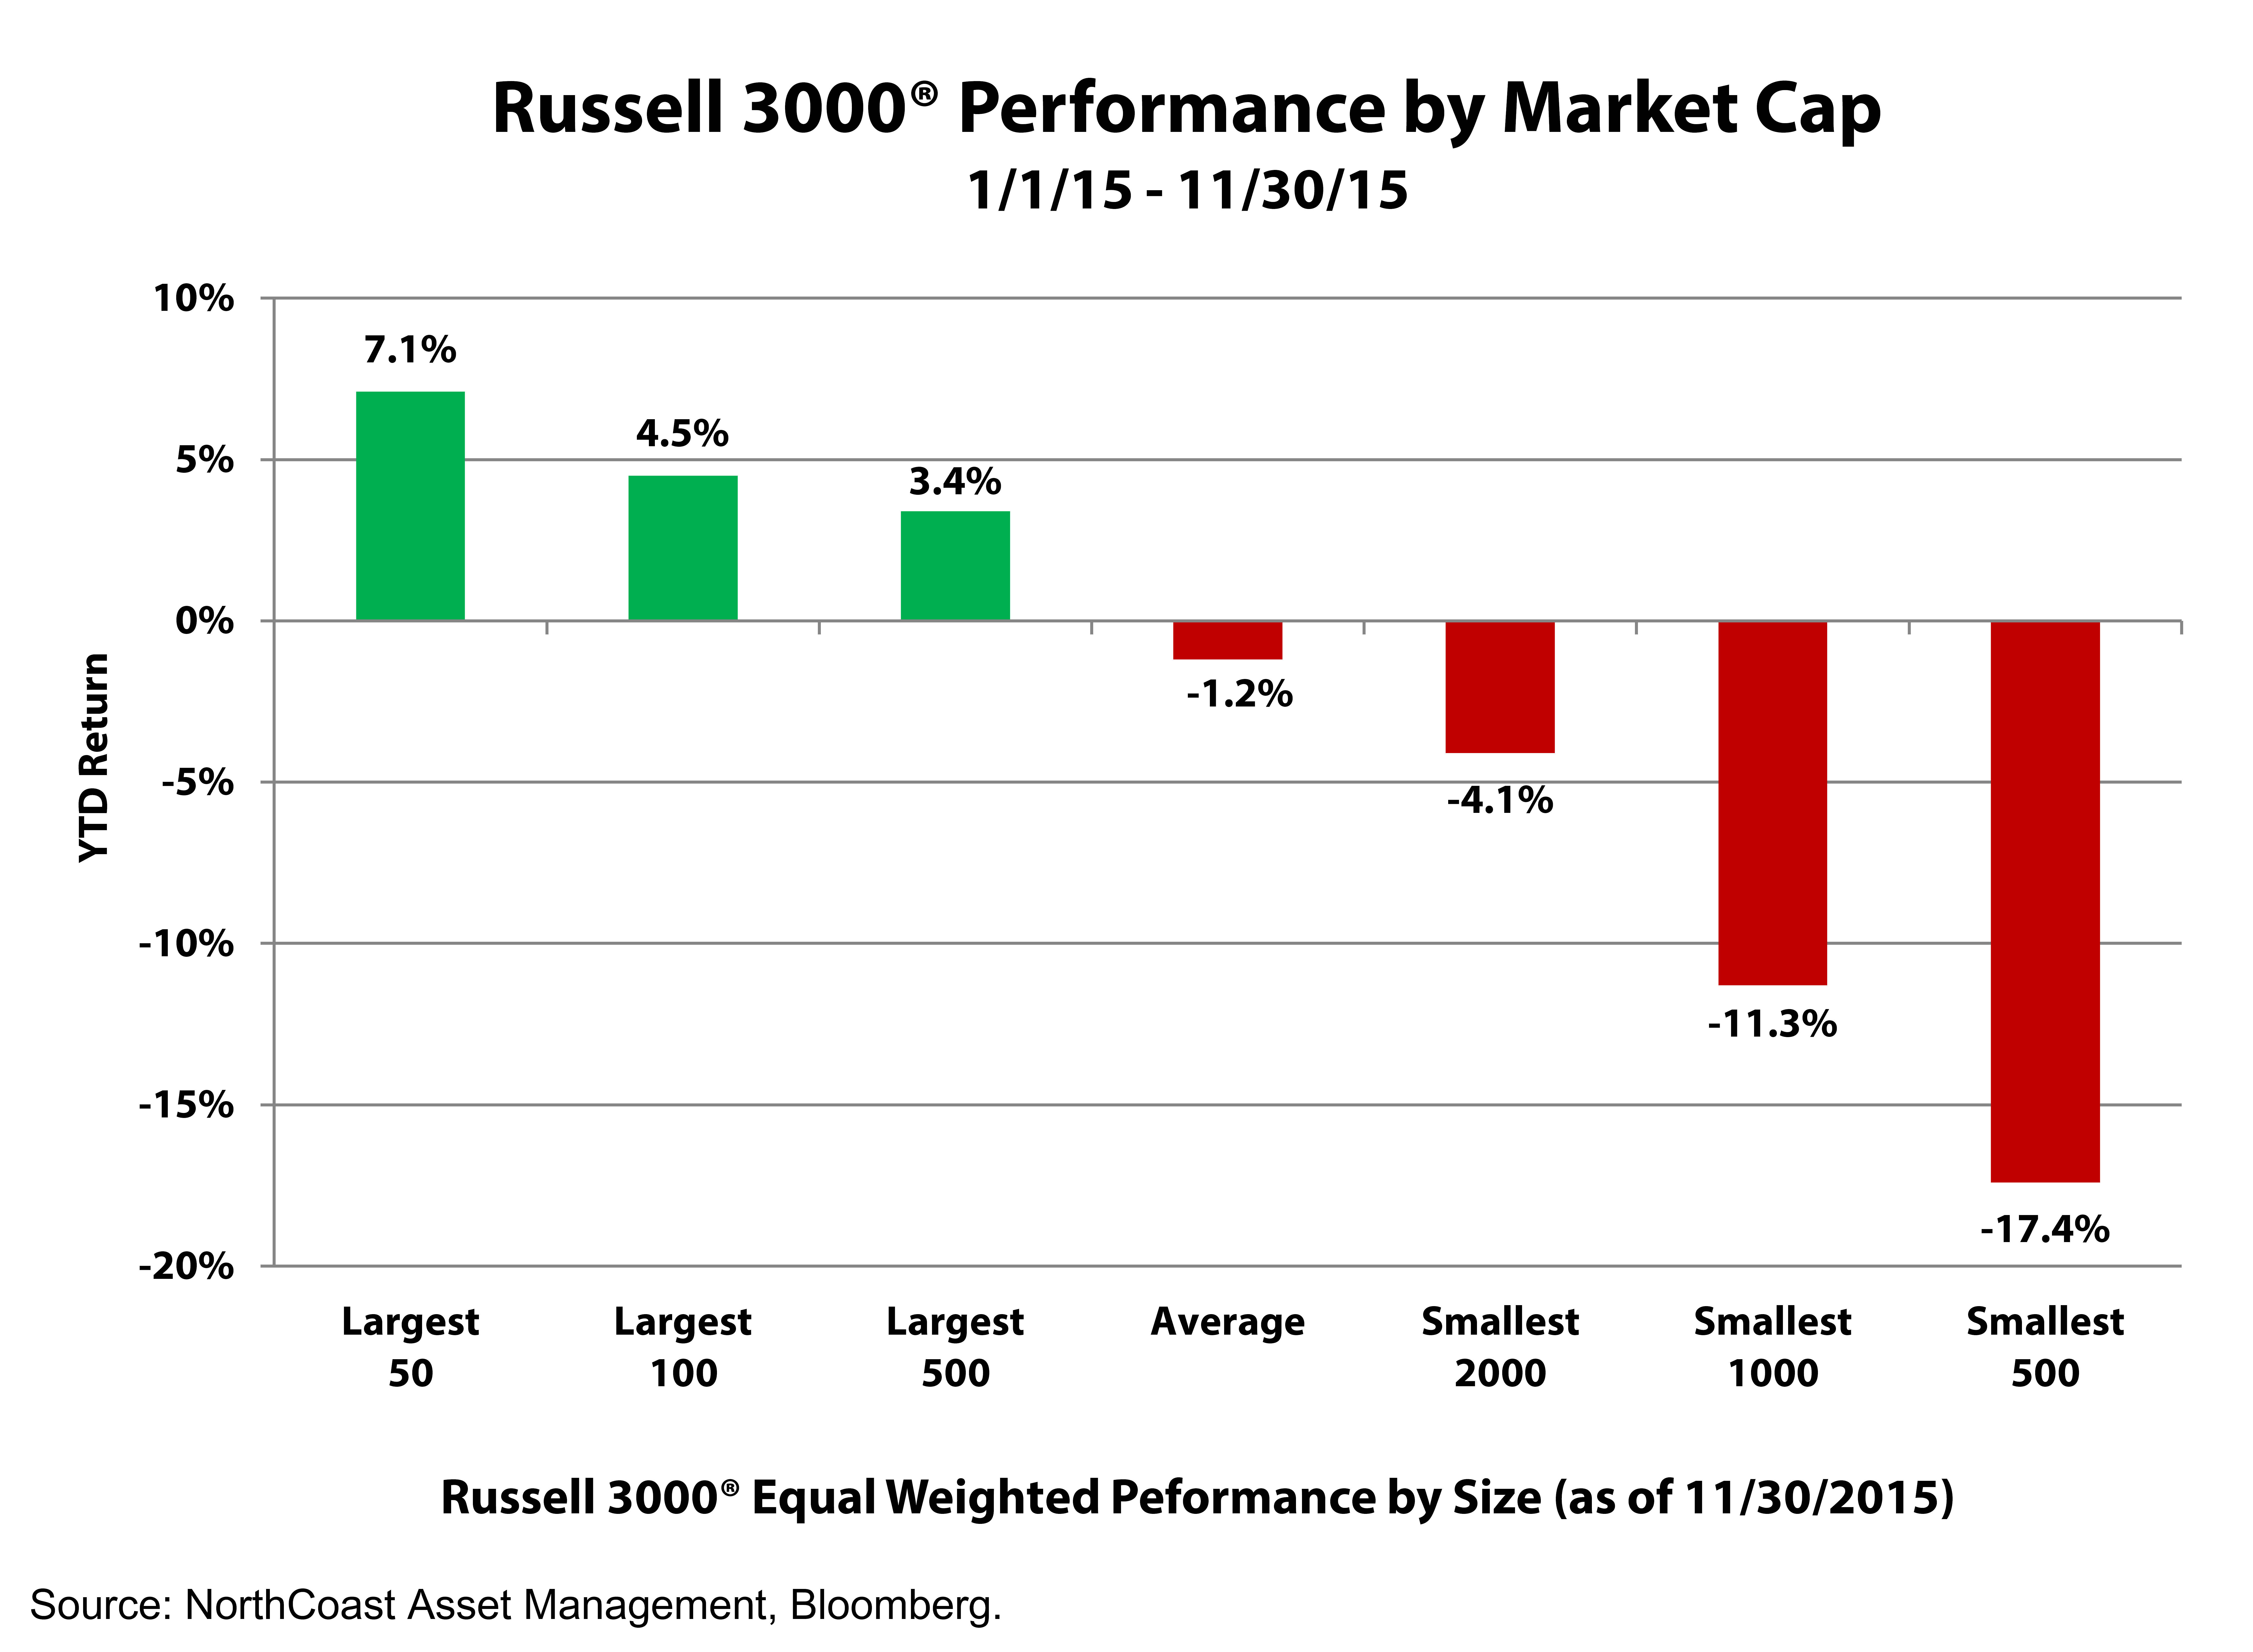
Fact to Consider: The average stock of 2015 is -1.2% YTD.
While the Russell 3000® Index is +2.6% YTD, the average stock in the index -1.2% YTD. This deviation is the result of the largest companies providing the majority of gains in 2015. This is illustrated in the chart below, breaking down the performance by market-capitalization. 2015 is likely to cross the finish line as a year in which concentrating in the largest mega-cap companies was the best investment decision. We know this is not always the case but an important detail to consider when analyzing returns. (The Russell 3000® Index measures the performance of the largest 3,000 U.S. companies representing approximately 98% of the investable U.S. equity market.)

